Diagnostic at switch on
At switch on RTE, finding one or more ECATx.cfgx files on the Compact Flash, executes all the commands in them, verifying the real presence of devices on the line. In case of an anomaly, the alarm 82 ECAT(int ) No Communic.(code ) is generated and through the shell command MREPORT -A it will be possible to obtain additional information.
Examples of errors during EtherCAT network configuration
4 nodes are declared in the ecatx.cfgx file and only 3 are detected by RTE:

The Ethernet cable is not connected:

In the case of success the FB.CFG file is searched and then analyzed.
In the case of an anomaly, the warning 9209 FB.CFG configuration fault (code-line) is generated, and through the shell command MREPORT -S it will be possible to obtain additional information.
Example mreport -s

NOTE: line<20.14> means line 20, column 14.
If all is okay, before putting the line into operational, RTE runs the BOPEX.STP file if present in compact flash.
Diagnostic by scanning the network
Using the shell command ECAT_PROBE, an EtherCAT network can be scanned to see which devices are seen by the control. It is possible to scan a single device or perform detection of all devices present.
Diagnostic during functioning
If one of the nodes fails RTE generates the alarms 82 ECAT(int ) No Communic.(code ) and 83 ECAT(int) Lost comunication with lost nodes out of total.
If a node to which a RID (Remote Device) has been associated has some fault condition RTE generates the alarm 80 RFB ws<id> fault <code>.
If a node to which a RID (Remote Device) has been associated transmits an emergency message RTE generates the alarm 81 RFB ws<id> emcy <code>.
If a node to which a RID (Remote Device) has been associated and also an axis has some fault condition RTE generates alarm 18#nn RFB ws <id> fault <code>.
If a node to which a RID (Remote Device) has been associated and also an axis transmits an emergency message RTE generates alarm 19#nn RFB ws <id> emcy <0xeeee> <0xqqttdduu>.
NOTE: Alarms 82, 83 can be changed to warnings, thus without dropping the Power Set, by acting on the predefined variable FB_FLAG.
In case of problems on an EtherCAT line, each slave has standard diagnostic registers that can be read from the shell via the ECAT_FPRD command (e.g., from shell: ecat_fprd 1 1001 0x134).
The following table summarizes the main diagnostic registers with their meanings:
Register Number |
Register name |
Meaning |
|---|---|---|
0x130:0x131 |
AL status [register] |
Device status (See table below) |
0x134:0x135 |
AL status code |
Error code (See table below) |
0x310 |
Lost link counter port 0 |
Counter of how many times the Ethernet link has been lost. Generally in slaves with only two Ethernet ports, port 0 is the input port and port 1 is the output port (ports 2 and 3 are not used). NOTE: Refer to the slave device manual for information regarding port assignment. |
0x311 |
Lost link counter port 1 |
|
0x312 |
Lost link counter port 2 |
|
0x313 |
Lost link counter port 3 |
|
0x300 |
Frame error counter port 0 |
Counter of ECAT frames in which an error (CRC or other) was detected. No EtherCAT interface is perfect; the counter is expected to increase by 1 over about 1 week. If the counter suddenly increases then there is a problem on the line |
0x301 |
Physical layer error counter port 0 |
Physical signal error counter. Usually at switch on it is normal to be different from zero. If the counter suddenly increases then there is a problem on the line |
0x302 |
Frame error counter port 1 |
See description for port 0 |
0x303 |
Physical layer error counter port 1 |
|
0x304 |
Frame error counter port 2 |
|
0x305 |
Physical layer error counter port 2 |
|
0x306 |
Frame error counter port 3 |
|
0x307 |
Physical layer error counter port 3 |

Diagnostic by information files
Information files are created within the RAM memory of the motion control and can be accessed using the FVIEW shell command or the LVIEW device command.
To view these files, which are hidden by default, use the FDIR -H command.
NOTE: To save these files to Compact Flash in order to have a more comprehensive SYSTEM_LOG it is recommended, through the use of the LVIEW command, that these commands be placed in the USERLOG.STP file.
The files are:
FVIEW /proc/bus/ecat/ethX/log |
Displays the log of operations performed by RTE at boot time |
FVIEW /proc/bus/ecat/ethX/master/probe |
Displays the list of devices found by the master on the line |
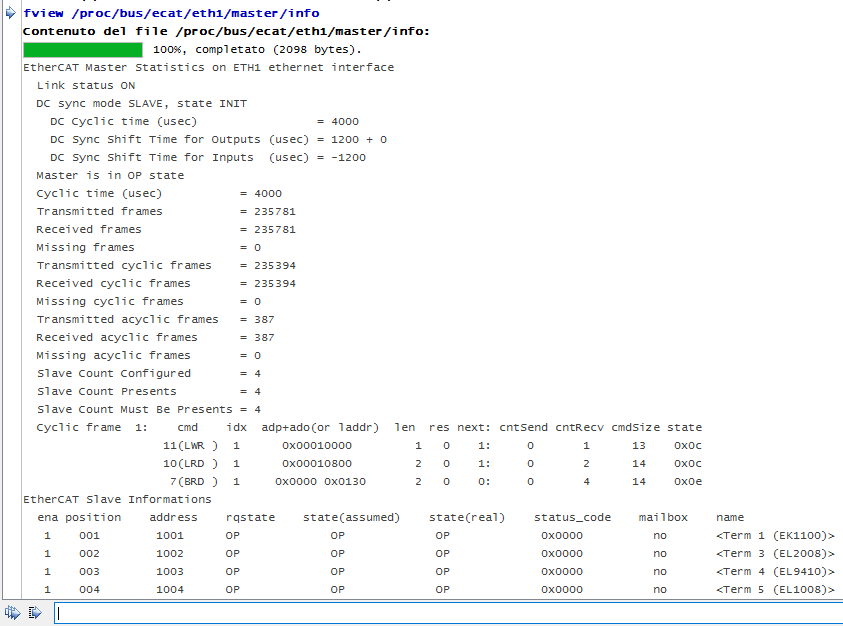
FVIEW /proc/bus/ecat/ethX/master/info |
Displays information about the master |
FVIEW /proc/bus/ecat/ethX/slaves/info |
Displays information about the slaves |
FVIEW /proc/bus/ecat/ethX/slave_XXX/info |
Displays information about the indicated slave |
Where:
•The X in ethX identifies in ethernet port number (eth1 or eth2 ...)
•The XXX in slave_XXX are the progressive device number (slave_001 , slave_002 ....)
Example
Diagnostic parameters
ECAT_DIAG_SLAVE_STATE |
Operational status of nodes |
ECAT_DIAG_SLAVE_PRES |
Number of nodes actually present |
ECAT_DIAG_SLAVE_COUNT |
Number of nodes configured |
ECAT_DIAG_SLAVE_DISCON |
Number of nodes expected to be disconnected |
ECAT_DIAG_SLAVE_MUST_BE_PRES |
Number of nodes expected to be present |
ECAT_DIAG_MASTER_STATE |
Operational state of the master |
ECAT_DIAG_MASTER_MISS_CYC_FR |
Number of synchronous frames lost |