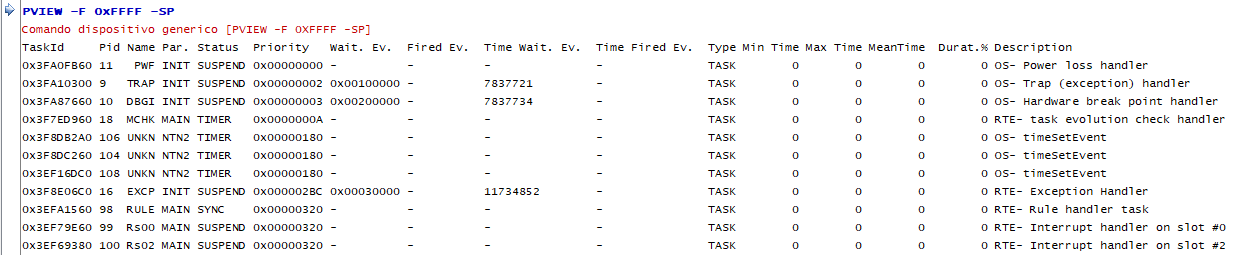
Shows the list of system processes.
NOTE: From RTE 34.24.1, task time acquisition is handled through the TT command.
Syntax |
PVIEW [-F mask] [-Ssort] [-H] |
||||||||||||||||||||||||||||||||||||||||||||||||||||||||||||||||||||||||
|---|---|---|---|---|---|---|---|---|---|---|---|---|---|---|---|---|---|---|---|---|---|---|---|---|---|---|---|---|---|---|---|---|---|---|---|---|---|---|---|---|---|---|---|---|---|---|---|---|---|---|---|---|---|---|---|---|---|---|---|---|---|---|---|---|---|---|---|---|---|---|---|---|---|
-F mask |
Indicates the information mask to be displayed. (Optional, default 0x7835). Each mask bit has an entry associated with it, which will be displayed if it is set to 1:
|
||||||||||||||||||||||||||||||||||||||||||||||||||||||||||||||||||||||||
-Ssort |
Specifies how the processes are to be ordered, available values are:
|
||||||||||||||||||||||||||||||||||||||||||||||||||||||||||||||||||||||||
-H |
Show previous table with mask information. (optional) |
||||||||||||||||||||||||||||||||||||||||||||||||||||||||||||||||||||||||
Notes |
NOTE: (*) valid only for ad hoc compiled versions of RTE.
NOTE: (**) valid only using TT 3 and TT 4.
NOTE: (***) valid for RTE >= 34.31.1.
Example
I display the processes loaded on the control with all available information (-F 0xFFFF) in order of priority (-SP).